MORE THAN ALL OF IT
I’ve been concerned about the frequent theme in the media about the fraction of global warming that is man-made. It is a poorly posed question, because it implies that there is a pie chart with some slice or slices of the pie being man-made and some slice or slices being natural.
But what if, in the absence (or relative near-absence ) of human interference, the climate would be cooling? After all, it’s agreed that the world has been cooling since the “Holocene optimum” - this is a point that is commonly wielded by the inactivist camps after all. Look:

If you extrapolate the background trend (ignoring the hockey stick blade at the end) you will see that from first principles, a slow cooling is a reasonable expectation for the natural trend. This would mean that the anthropogenic contribution is not sharing in the warming with natural factors, but actually pulling against a (relatively small) natural cooling, probably orbitally forced. Thus if one had to express anthropogenic warming as a percentage of total warming, the total fraction would be over 100%.
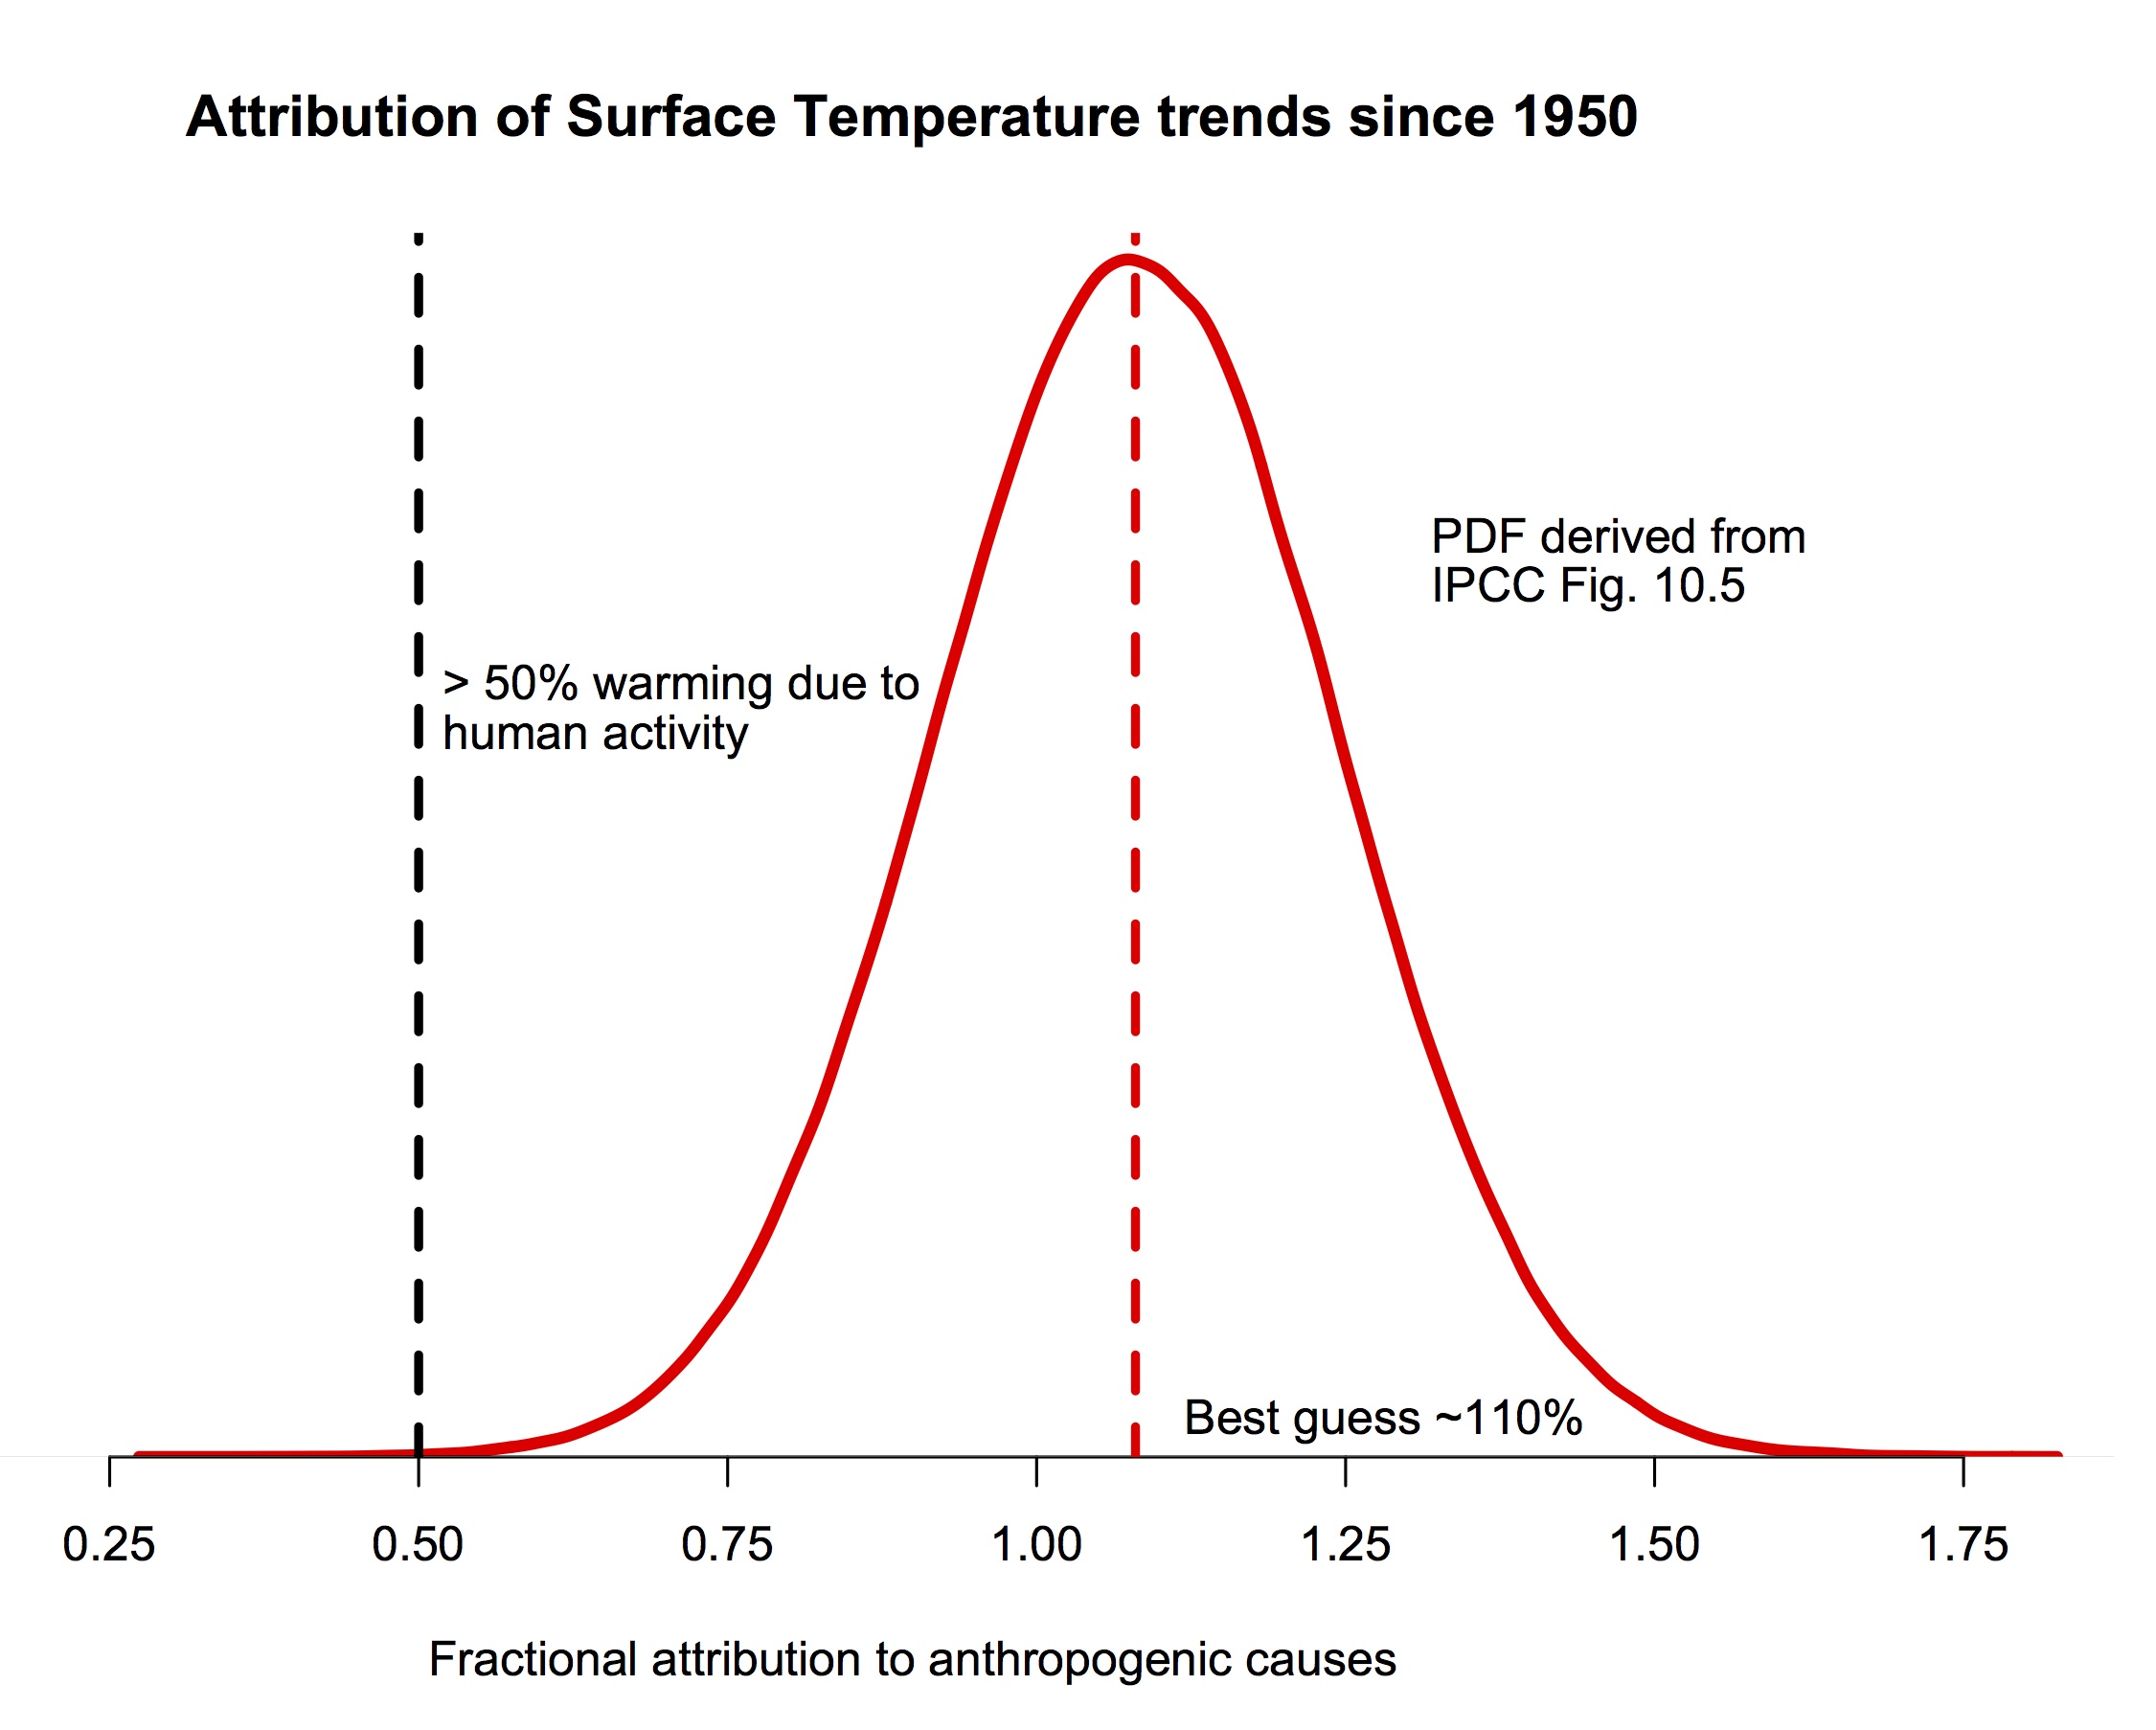
And indeed, on top of the natural background cooling, indications are that the natural forcings (volcanic, solar) are also slightly toward cooling. None of this is overwhelming - the natural trends and forcings on global mean temperature are small, and internal variability (basically just the slow sloshing around of the water masses of the ocean) is also important on the decadal time scale. The net result is that we have an uncertainty in the percentage attribution:
And indeed, on top of the natural background cooling, indications are that the natural forcings (volcanic, solar) are also slightly toward cooling. None of this is overwhelming - the natural trends and forcings on global mean temperature are small, and internal variability (basically just the slow sloshing around of the water masses of the ocean) is also important on the decadal time scale. The net result is that we have an uncertainty in the percentage attribution:

(sorry for fuzzy image; will replace when RC is back up 11/21/15)
but it’s also true that the best bet is in excess of 100%.
Now, as I pointed out in 2004, this is counterintuitive:
Now, as I pointed out in 2004, this is counterintuitive:
What does “people are causing this” mean? Does it mean people are responsible for all of the warming, most of the warming, some of the warming? “At least the majority of it” captures the consensus opinion, I believe. The possibility of the anthropogenic forcing being superimposed on a natural background cooling is not, as far as I know, excluded. Though it complicates the clarity of public communication, “more than all of it” is actually a possibility.
HOW THIS GETS LOST
The summary language the IPCC used to express this in AR5 was:
“It is extremely likely that more than half of the observed increase in global average surface temperature from 1951 to 2010 was caused by the anthropogenic increase in greenhouse gas concentrations and other anthropogenic forcings together. The best estimate of the human induced contribution to warming is similar to the observed warming over this period.”
This seems to make the best of a bad situation - it starts with a very clear near-certainty, then asserts that most likely just about all of the change is anthropogenic and a person thinking about it carefully would realize that “all” is not a cap. That isn’t even implicit. I would say this language handles the complex communication elegantly.
Nevertheless, language of public communication stumbles over this, and often fals back to the weaker but more easily understood assertion that climate change is “mostly” anthropogenic.
NASA Most climate scientists agree the main cause of the current global warming trend is human expansion of the "greenhouse effect"http://climate.nasa.gov/causes/
EPA:Most of the warming of the past half century has been caused by human emissions of greenhouse gaseshttp://www.epa.gov/climatechange/science/overview.html
UCS:“humans are the main cause of global warming”http://www.ucsusa.org/global_warming/science_and_impacts/science/human-contribution-to-gw-faq.html#.VMFiK2TF8ew
Parliament of Australia:“on the basis of considerable evidence, there is a strong consensus in the climate science research community that the changes that have been observed over the past few decades are mainly caused by human activity.”http://www.aph.gov.au/About_Parliament/Parliamentary_Departments/Parliamentary_Library/Browse_by_Topic/ClimateChange/whyClimate/human
even
Scientific American:“Natural climate variability is extremely unlikely to have contributed more than about one-quarter of the temperature rise observed in the past 60 years”http://www.scientificamerican.com/article/three-quarters-of-climate/
Not a word of these claims is remotely false, but they leave a systematic misimpression: that the changes we are seeing have multiple candidate causes among which human forcing is only one. This language leaves room in the reader’s mind for a debate which doesn’t really exist. The warming we see is accounted for **and then some**, but the reader can easily misconstrue these many statements from the more sober participants as saying otherwise.
WHY THIS MATTERS
There’s a sequence of dilutions; from what scientists perceive to what scientists are willing to say publicly; from what scientists say to what the IPCC process will approve; from what the IPCC process approves to what the general public and the policy sector understand. And so, there’s a secondary story buried under the bizarre Senate votes this week that interests me more than the bizarre dance of politics.
The sense of the senate resolution that went down to narrow defeat was that human activity “significantly contributes” to climate change. Nothing about utterly dominating climate change, which in fact is what we are trying to tell the world. I don’t think people get us. This “certainly more than half” language is contributing to a widespread sense that “some other warming cause also exists”. I’d like to see a public opinion poll on that.
The reason I've finally given voice to these concerns, though, is damned peculiar.
ENTER JUDITH CURRY
Along those lines, I was pleased to find something Judith Curry said that I could agree with. She tweeted, well, I’m not sure what exactly (the tweet has vanished as far as I can tell), but the general sense of it must have resembled the subsequent tweet
The public views percent as 0-100, part of a divisible whole; not in a mathematical 'budget' sense where can exceed 100%
I've long said best estimate of anthro component to GW slightly over 100%. Agree use of "per cent" misleads. Said that too @curryja .
I understood her to be complaining about the communication problems associated with expressing the anthropogenic component of warming as a fraction or a per cent. And I was pleasantly surprised by this shared insight and this bit of evenhandedness on Curry's part.
But I totally forgot the Law of Curry: "It's worse than you think, even when you account for the Law of Curry".
The exchange continued in a similar vein for a bit
mtobis @mtobis Jan 21My point is that the public seems unaware that 110% is even possible, never mind the best estimate @swimsure Not sure what @curryja's is.
\Judith Curry @curryja Jan 21@mtobis @swimsure The public views percent as 0-100, part of a divisible whole; not in a mathematical 'budget' sense where can exceed 100%
but then the Law took hold and it took an abrupt turn to the bizarre:
There's Physics @theresphysics Jan 20 Okay, I'm confused. Isn't "more than half" the same as "> 50%"? http://wp.me/p12Elz-4Al via @curryja
Judith Curry @curryja Jan 20 @theresphysics Read the post. Does 110% mean more than half? No - it depends on how big the other slices are, not constrained between 0-100%
There's Physics @theresphysics Jan 20@curryja Huh? Of course 110% means more than half. It certainly can't be less than half. F
Judith Curry @curryja Jan 20 @theresphysics what if the other piece is 220%? your 110% is now less than half.
Judith Curry @curryja Jan 20 @theresphysics the issue is less than half of 'what', which is not defined. if constrained to 0-100% all is clear
There's Physics @theresphysics Jan 20 @curryja Half of the observed increase in global average surface temperature since 1950 - it couldn't be clearer.
Webb Roberts @webbr Jan 20 @theresphysics …but these go to eleven
(There's Physics discusses this exchange here.)
At first I read this to say that Curry was talking about multiple large pieces totalling to 100% and mocked her position thus
It COULD BE that stable climate of holocene is COINCIDENTALLY now subject to HUGE PERTURBING FORCES much bigger than greenhouse gases right?
and a couple of other people came to that interpretation too, but now I believe that even that interpretation is too generous.
Could “what if the other piece is 220%? your 110% is now less than half.“ really mean she thought we were allowing a total attribution of 330%?
Does she really not understand that residual after 110% is accounted for is negative? The more I look at these exchanges (and looking back on Twitter streams is an amazingly awkward task, by the way - please fix this Twitter) the more convinced I am that she thinks that if one piece is 110% of the total then WE DON'T KNOW HOW MANY PER CENT THE TOTAL IS!
You know, I think that is really what she meant. WE'RE DOOMED
This is the level of confusion we are faced with in dealing with Dr Curry. Far from a good grasp of nonlinear partial differential equations you’d expect from a research meteorologist with a specialty in tropical storms, Curry does not appear to grasp the idea of negative numbers, at least in this context.
She is so fixated on the pie chart, and on the natural component being positive, (despite the fact that she once allowed a possible sensitivity of 10 C per doubling - what’s up with that?) that she thinks an anthro component of 110% means a total change of more than 100% of the total change!
Now I figure if she takes notice of this she will try to find some other way to put it, but I'll be interested to see how she accounts for some of her statements.
I am sorry, this is far from the threshhold of qualified or not qualified to be a full professor.
Anyone who thinks all is roses in the garden of science has to account for the rise of Dr Curry to a position of responsibility in academia. (Here I am on the sidelines and there sits Judith Curry on top of the heap. To be honest I never had the energy to try to climb the tenure ladder, but still, try to imagine how I feel about this.)
Then we further have to find some way to account for her being influential enough politically to be invited to give testimony to what passes for a Congress in this country nowadays.
On the whole, my conclusion is this
Then we further have to find some way to account for her being influential enough politically to be invited to give testimony to what passes for a Congress in this country nowadays.
On the whole, my conclusion is this


16 comments:
Let Eli google that for Judy
>looking back on Twitter streams is an amazingly awkward task, by the way - please fix this Twitter
+1
A search function would be nice too.
***
> WE'RE DOOMED
From now on, I want this as a mandatory section for all your posts, Doctor. Or shall I call you Victor?
Okay, you may have a point. I hadn't considered that Judith was suggesting that by using 110% (i.e., bigger than 100%) "the whole" could be any number of percent, rather than "the whole" being 100%. That's quite something.
ATTP,
I must admit that now I'm a bit confused.
I'm looking at:
http://www.climatechange2013.org/images/report/WG1AR5_Chapter10_FINAL.pdf
http://www.climatechange2013.org/images/report/WG1AR5_Ch10SM_FINAL.pdf
From the SM (Figure 10.5):
"This figure shows the assessed ranges derived as described in Section 10.3.1.1.3. We derive assessed ranges for the attributable contribution of greenhouse gases (denoted GHG, green), other anthropogenic forcings (OA, orange) and natural forcings (NAT, blue) by taking the smallest ranges with a precision of one decimal place that span the 5 to 95% ranges of attributable trends for the 1951–2010 period from the Jones et al. (2013) weighed multi-model analysis and the Gillett et al. (2013) multi-model analysis considering observational uncertainty (Figure 10.4a). The assessed range for the attributable contribution of combined anthropogenic forcings was derived in the same way from the Gillett et al. (2013) multi-model attributable trend shown in Figure 10.4c. The assessment of the internal variability is taken from the estimates of the 5th to 95th percentiles of 60-year trends of internal variability estimated by Knutson et al. (2013). We moderate our likelihood assessment and report likely ranges rather than very likely ranges directly implied by these studies in order to account for residual sources of uncertainty (see Section 10.3.1.1.3). Shown on the figure are the likely ranges shown as the whiskers with the end of the coloured bars being at the mid point of the attributable trend ranges. The midpoint of NAT is zero but the blue NAT bar is widened to make it visible."
So Figure 10.5 has "a precision of one decimal place" (actually it looks like 0.05 precision, the OBS perhaps 0.01 for the error bars).
The NAT and IV make no net mean contribution, so you have OBS = ANT = GHG - OA?
Component,mean,confidence interval = likely (66% ~ sigma)
OBS,0.65,0.06
GHG,0.9,0.4
ANT,0.7,0.1
OA,-0.25,0.35
(looks to me like a small rounding error?)
Anyways, still don't quite understand the respective error bars for GHG, ANT and OA. Have requested a copy of Jones (2013).
EFS,
If I understand your point, you're wondering why the error bars on ANT are small when the errors bars on GHG and OA are not. I'll see if I can explain.
If you were to simply add - in quadrature - the GHG and OA together the result would be an anthropogenic contribution with a large error bar. So, anthropogenic influences could have produced very little warming, or much more warming than we've seen.
Okay, but if it produces much less than we've seen, what produces the rest? The only possibilities are Sun, volcanoes, internal variability. When you look at those contributions, it's clear that they can't have produced a lot of warming. Therefore, OA + GHG cannot have produced much less warming than we've seen as that would imply that IV + Sun + volcanoes produced much more than we think is possible.
Similarly GHG + OA cannot have produced much more warming than we've seen since that would imply Sun + IV + Volcanoes produced much more cooling than we think possible.
Therefore, the overall ANT contribution is constrained by both the range of possible warming due to GHG + OA and the range of possible warming/cooling from Sun + Volcanoes + IV. Together this means that the error bars on ANT are much smaller than you would expect if you consider GHG + OA in isolation.
At least, I hope that is what you were wondering about.
ATTP,
Yes, I think I see what you are saying.
Given OBS, NV (IV + NAT) and ANT (OA + GHG), that as far as they know (e. g. climate scientists) NV << either component of ANT (both in terms of the mean and sigma), therefore ANT sigma must approximately be the same as NV sigma.
I'm really old school now, my math skills are nowhere what they once were, I always find the need to work these things out via a spreadsheet, or have a Climate Science for Dummies worked out example, to better understand the fundamentals.
I am looking into the quadrature thing and error propagation, there may still be hope for me yet.
However, I do wish that Figure 10.5 had been rounded to two digits of precision throughout. After all, it is just a chart (don't think I've seen a corresponding table of numbers that that figure).
Also, I'm sort of wondering if those error estimates were all derived independently of one another, or if a closure budget was used.
" I hadn't considered that Judith was suggesting that by using 110% (i.e., bigger than 100%) "the whole" could be any number of percent"
Yes, it took me a while as well. We failed to account for the Law of Curry. Either way she is making no scientific sense, but this way she is at least making semantic sense. The fact that this expresses a level of confusion that would be a bit disappointing in a ninth grader is impressive. Yet despite what appears to be confusion at the most elementary possible level, she wrote a long article and got lots of plaudits.
Hence, doom.
EFS,
I don't the exact details, but - yes - I think what you say about how the error bars were determined is how I understand it.
MT,
What Curry says often surprises me greatly as it seems so odd to see a senior scientist with the record she has, say things that seem simply wrong. I have a similar issue with Pielke Sr. He has a remarkable scientific record and yet - more than once - I've had discussions with him where he appears not to understand how energy balance calculations work (despite using them) and doesn't seem to understand feedbacks well.
The question ha always been whether Curry has been qualified enough to speak for the science of climate change.
The "more than half" issue shows how poorly she handles elementary logic.
And then is the physics flub where she tried to model cloud nucleation using Bose-Einstein statistics. The way she tried to wiggle out of that one was by having her poor Russian co-author defend it on a blog post.
"Hence, doom."
So, does this meant that you're moving into the McPherson camp?
I attribute 110% of my comment to sarcasm, the other 220% is serious. I think.
Not having anything better to do (actually, procrastinating to avoid working on a procedure I have to write for my job and some homework) I went to ATTP and to a few of the comments on Curry's blog.
In advance, I realize the irony of my making this comment but OMFG, the energy (literal energy of the CPUs and monitors) that has gone into parsing this is shocking!
I found a single comment on ATTP that seemed to have value beyond trivial discussions about what "most" means (Tom Curtis went so far as to semantically characterize "most" and provide a link for our edification as well as an example of how it can correctly be used to mean both "more than half" and "the largest plurality" in the same paragraph because, you know, nobody had any idea about that subtlety) and other trivialities.
The valuable comment came from whimcycle and, as far as I can see, nothing more really need be said.
Maybe I should make a post about it, nobody takes my blog seriously (if they read it at all) so it's an appropriate place. But I did enjoy the Monty Python and the Spinal Tap nostalgia.
The "attribution" figure with the Bell curve is a bit flawed though, as one would expect the left side of the curve to stick a bit past the 50% limit.
It's not necessary that the Bayesian distribution be exactly normal.
To be overly fair, if you assume we know nothing, and therefore could believe there was a 110% effect, a 220% effect and a -230% effect, then one would be correct in saying that the 110% effect was the smallest of the three, and justified in saying it was less than half of what was going on. But of course we know enough about the system to rule out the existence of larger, counterbalancing effects.
Well, we are not so doomed at this time, but we are not far from a disaster.
I truly don't understand why some people deny the climate change facts.
They all get paid by industry cartels to say all these or they simply can't see the reality from outside they room.
http://www.alternative-energies.net/some-people-think-that-extreme-low-temperatures-in-the-u-s-are-a-sign-that-global-warming-is-just-a-joke/
Maybe we need to take them to the poles to see that the ice is almost gone.
Thanks for this, which comes in useful when the argument comes up. I was a little confused by it myself, but if you regard $1 as 100% of the price and the price goes up, the new price of, say $2.20, is 220% of that. Quite simple once you know.
Pay no attention to that man behind the curtain.
Best regards mt ...
Post a Comment