"Our greatest responsibility is to be good ancestors."

-Jonas Salk

Thursday, May 1, 2025

Ask Me Anything


This post will be updated before and after the AMA event.

Some points for discussion

Humans are the dominant force in today’s very rapid climate change.


https://en.wikipedia.org/wiki/Global_surface_temperature

there are a lot of reasons to associate this with CO2


https://keelingcurve.ucsd.edu/


but there are other factors


https://archive.ipcc.ch/publications_and_data/ar4/wg1/en/figure-spm-2.html


Canada has contributed more than its fair share.

https://decarbonization.visualcapitalist.com/global-co2-emissions-through-time-1950-2022/


Climate always changes but rapid climate change is associated with major extinction events -- massive die-off of insects, plants and animals.


The current rate of global warming and species extinction only has parallels deep in the geological record. More specifically, with the previous five mass extinctions in Earth’s history (Fig. 1). Although those previous extinction events were triggered by distinct phenomena (as far as current theories ago), they seem to elicit similar long-term effects on biodiversity 

incredibly detailed picture of some of these events have come to light. My favourite comparison is with the Permian-Triassic mass extinction at 251.9 million years ago (Ma). Not only this is my current subject of research, but it has also important parallels with current climate change. For instance, both are marked by substantial input of CO2 into the atmosphere (released from hundreds of thousands of years of volcanic activities in what is today Siberia) and potentially aggravated by subsequent release of methane from deep ocean sediments. Perhaps alarmingly, it is estimated that the rate of carbon input into the atmosphere at the end Permian was between 0.42 and 1.52 gigatons of carbon per year (Gt C/yr), whereas current human-induced levels of carbon input are of 31 Gt C/yr! It is not to say that the current warming event is necessarily worse than the one that caused the greatest mass extinction in the history of complex life at 251.9 Ma (this rate would have to sustain for tens or hundreds of thousands of years for that to be true), but only that the current rate of carbon input into the atmosphere is alarmingly high compared to some of the most dramatic events in the geological record.

Tiago R. Simões https://communities.springernature.com/posts/lessons-from-the-deep-past


Note that recovery times from the great extinction events are millions of years.

Also, when a substantial fraction of species dies, that means a l;ot more species NEARLY died. Most species populations declined severely

Weather everywhere is connected in the global climate system; the physics are well-understood and not controversial.

The weather is the result of energy flows into and out of the earth system. Over the long term these are in balance or the world will warm or cool very quickly. mThey are well understood and mostly well quantified. Best evidence is that there is currently an imbalance of about 1 watt per square meter, which will cause gradual but constant warming until balance is achieved again. But the increase in greenhouse gases continues to disrupt the balance.


The evidence that this view is correct is in the accuracy of weather models and the success of climate models in replicating observed climates. These models are properly called "simulations". The properties of the system emerge from the modeled physics.


A climate model, more specifically a general circulation model (GCM), is a mathematical representation of ocean/atmosphere/land systems based on physical principles (e.g., conservation of momentum, mass, and heat). The physical principles are formulated as a set of equations and these equations are numerically solved on every 3-dimensional grid divided on the globe. 

https://cml.jbnu.ac.kr/cml/11846/subview.do


https://hrcm.ceda.ac.uk/blog/plot-of-the-month-mar-2019-10km-global-modelling/


The largest uncertainty in climate prediction is human action -- especially how much fossil fuels we will consume. You ain't seen nothin' yet. Climate change is going to get worse. We can only affect how much worse.


Fossil carbon accumulates. Natural drawdown is very slow. We need to leave a lot of fossil fuel resources untapped.


https://www.carbonbrief.org/explainer-how-the-rise-and-fall-of-co2-levels-influenced-the-ice-ages/


 Canada may get off relatively lightly economically, but the natural impact will be enormous. All our forests are at risk.


 https://sciencemediacentre.es/en/pep-canadell-we-are-heading-much-warmer-world-15-degrees-warmer


Threats to species in Canada

Increasing importance of climate change and other threats to at-risk species in Canada

any mention of climate change as a threat increased from 12% to 50% in 10 years. Other anthropogenic threats that have increased significantly over time in the paired analysis included introduced species, over-exploitation, and pollution. Our analysis suggests that threats are changing rapidly over time, emphasizing the need to monitor future trends of all threats, including climate change.

https://cdnsciencepub.com/doi/10.1139/er-2020-0032 


 https://ourworldindata.org/grapher/global-primary-energy

Global direct primary energy consumption

https://ourworldindata.org/grapher/global-primary-energy


ice sheet instability


Saturday, April 12, 2025

I know something about art, but I know what I like anyway


Usually, looking at a painting, I think, hmm, okay, I wish I could do that, but once in a while I go whooaaa.... wow.... that's... wow...
Not unlike with a great musical performance.
So now, I'm suddenly, inadvertently, a person who writes about art.
I've noticed that people who write about music, especially popular music, tend to love music a lot; but people who write about art, sometimes give off the impression that they don't care, or they don't even get it.
My problem is that I know what I love but I don't know why. But is that really a problem?
I certainly don't have an overarching theory. Why should I? What makes great reggae and what makes great blues and what makes great jazz are different. I know what I want to listen to and what I don't when I hear it.
I also know what I want to look at when I see it. But I don't have or want some grand theory as to why.
I think basically everyone loves music but only some people love visual art for some reason.
Since everyone loves music, everyone who writes about music loves it. On the other hand, NOT all of the people who write about art are people who love it.
I know what I love in art, just as I know what I love in music. And I know a fair amount at least about art (and perhaps a bit less but still something about music). But I can't explain WHY I like what I like in some broad general terms.
You enjoy each bit of human creativity in its own terms.
I think anyone writing about art has to BEGIN by acknowledging the mystery. We love this stuff. We LOVE this stuff. Why? It's sort of mysterious.
We especially love SOME of this stuff. Which ones? Why?
It's totally experiential. In experiencing any art form, either your socks are knocked off, or they ain't.
If you have a talky personality you really WANT to talk about the stuff you love and what it means to you. And you don't so much want to talk about the stuff you don't love, except maybe to wonder why it didn't work.
But you wouldn't know it from a lot of people who are professional curators and art educators. They seem to have forgotten what they love about art, if there ever was anything.
Anyway, sometimes, the only thing you can say is wow... look at that...

--

painting is a field sketch by Tom Thomson ca 1916

Sunday, January 12, 2025

GDJ #2: On crossing 1.5 C

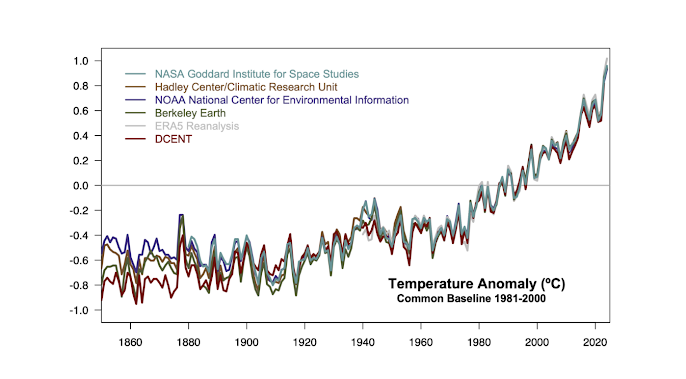
Here's the recent temperature trajectory.  Image via RealClimate

There are two things to look at. One is the astonishing temperature spike of the past two years, which ahs no obvious precedent, and is quite likely an ecceleration of some kind.

The second, and the linked article has a lot to say about this, is whether we have already surpassed the 1.5 C warming threshhold that emerged from the Paris Agreement as an "aspiration" for a warming limit.

I think it's worth me making a few comments on the latter. (This is a revision of a series of tweets on BlueSky: https://bsky.app/profile/mtobis.bsky.social/post/3lfkiam33kc2g )


So the first thing is that 1.5 C is a benchmark, determined by communication constraints rather than any known physical or environmental constraints. To be sure, there may be points along the warming scale where impacts get dramatically worse, though that's probably an oversimplification. Even if there were such points, we don't and can't know where they are until we pass them. Rather, the point of having benchmarks into the unknown territory into which we are propelling ourselves is to gain some collective awareness of whether we are succeeding in slowing our advance into the unknown (probably a little) or stopping altogether (not close). It's a way to communicate our status.

When this benchmark was far away, it seemed adequate to have a fairly rough idea of what it meant. As we get close it is ill-advised. Gavin's text reveals something of the original vagueness of the goal.

The people have spoken, and they have collectively agreed that ‘pre-industrial’ can be thought of as the average of 1850 to 1900. There were other candidates – but the influence of IPCC AR6 is too strong to fight against. So, while I’ve been holding on to ‘late 19th Century’ (in practice 1880-1899) as a baseline, I have bowed to the inevitable and started producing anomalies with respect to the earlier baseline. But that raises a problem – how do you produce an anomaly with respect to a baseline that isn’t in your data set?
The first sentence implies confirmation of my understanding that at the time of the Paris Agreement the Parties to the COP had not bothered to be precise as to the meaning of "1.5 C' or "2 C" of warming. And much of Gavin's piece works toward making the 1850 to 1900 benchmark precise. It's a sensible pursuit. If we are going to have benchmarks it's better that they not be fuzzy ones. But the fuzziness of the benchmark can be overinterpreted as fuzziness of the trajectory! Admittedly one could make a case that establishing the baseline tells us a little bit about the climate sensitivity (how much forcing leads to a given warming). It's not information-free in that regard. But it's not the best way to address that question or even a good way! It's main import is conventional. As a measure of urgency, our attentions are better dedicated to the much better measured (and concerning) end of the record and what it means than to arguing about the baseline.

GDJ #1: Less people than Los Angeles County

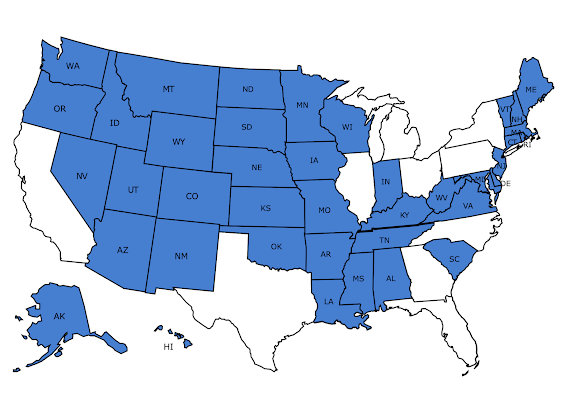
So I found a graphic online claiming to show all teh states with smaller populations than Los Angeles County, but it was incorrect, as it included Michigan, North Carolina and Georgia.

There are 40 states with populations smaller than Los Angeles County. There are nine Canadian provinces in the same category, the exception being Ontario. 

The population of Los Angeles County is 9.6 million. There are a *lot* of people directly affected by the current fire disaster.


#graphicdujour

(For what it's worth I did this in an online tool called SmartDraw, which is a Canva competitor. I can't recommend it so far. In the map you see I accidentally moved Kentucky and was unable to put it back where it goes, whence the double border with Tennessee.)