"Our greatest responsibility is to be good ancestors."

-Jonas Salk

Friday, August 7, 2009

Denialist Denial of Service

OK, so I usually leave politics off this blog. I am very much in favor of universal health care; I'm willing to leave the insurance companies alive if that's what it takes to get it in America. I don't hide this opinion, but I don't use this blog to flog it.

What is relevant is the disastrous turn the debates have taken. In the typical congressional recess, American congressmen hold lightly attended town hall meetings to discuss issues with the more engaged fraction of their constituencies. This tradition has been badly disrupted by concerted efforts to disrupt these meetings with loudly and urgently repeated misrepresentations of the legislation.

There was an incident here in Austin, one among many, apparently centrally organized, apparently funded in part by Republicans and in part by insurance interests, although drawing upon genuine backwoods fear and paranoia, as well as whatever racism might be handy to the purpose. (Despite the fascist methods, one common disruptive claim is to accuse Obama of being like Hitler. It's an interesting defense; brownshirts accusing the establishment of being brownshirts.)

The lies extend to absurd extremes.

This turn of events is now a crisis in itself. Obama is hamstrung: there's very little he can to to quell it. The press tries to handle it without "taking sides" validating the disruption; the weird skew the press seems to have decided to take (thanks to King of the Road for the link; I heard a very similar spin on NPR) is that the "country" is "terrified" of "too much change", which is horseshit so far but may end up a self-fulfilling prophecy soon enough. There's little alternative for concerned people other than to show up at these events and scream back, which in now way repairs the problem.

I gave a talk last month making an equivalence between policy and a feedback control mechanism. I am still planning to write it up, but things have been too interesting of late. It was already in my mind that the function of organized misrepresentation in a feedback mechanism is essentially the equivalent of introducing a large volume of noise into the feedback loop. In most engineering situations, that is not a good idea.

Meanwhile, in other news. Twitter was down for several hours yesterday. (One fellow lamented "I don't know what to do. It's like all the voices in my head have gone away.") Various other large web services had problems. It was what is called a "distributed denial of service attack", and here is how it goes. Over time, via various methods, various unobtrusive viruses are inserted into people's computers. Then, at the time of the denial of service, the viruses are invoked and make what looks like legitimate requests to the targeted service. But the requests are not real, and so do not complete, sending various protocols into various fallbacks. Ultimately the system itself breaks down and cannot provide the intended service.

As we see this DDoS happening to the town hall process, it is interesting to reflect on what is happening to the various branches of science that are under attack as well. The analogy is clear. Every bogus argument not only weakens the effectiveness of the communication between science and policy loop but also wastes the resources of the scientific community on defending itself. Bogus argumentation is distributed denial of service.

Consider another alarming fact for us Americaphiles:

Treehugger argues that this ridiculous circumstance is due to the prevalence of funded denialism in the US. (Other countries with strong denial movements, notably Australia and Canada, are not represented, unfortunately.) I think this is right. And it comes from people deliberately injecting noise into the social systems that used to be adequate to make reasoned decisions.

Ultimately these are difficult areas for law but easy ones for common decency. In a civilized world, people do not abuse systems for purposes other than those for which they are designed. The obvious decline of civilization has as one of its key causes the breakdown of purpose under an onslaught of cynicism. Promoting lies to a gullible public may not be illegal, but if there is a Hell (unlikely, alas) there's a special circle there for those who do it.

Update: The NYTimes has a thoughtful article about the collapse of the town hall mechanism under assault by partisan groups. There seems little question that the left has engaged in similar tactics in the past, though perhaps with less success. It's denial of service either way. Swamping information channels defeats nuanced governance, of societies as much as of machines.

Yudkowsky Again

I shouldn't have taken him off the blogroll, despite how exasperating he is with his conscious AI/singularity nonsense. He's (as they say in New England) wicked smart and he is an elegant writer.

He has an article called the Twelve Virtues of Rationality that is a keeper.
Let the winds of evidence blow you about as though you are a leaf, with no direction of your own. Beware lest you fight a rearguard retreat against the evidence, grudgingly conceding each foot of ground only when forced, feeling cheated. Surrender to the truth as quickly as you can. Do this the instant you realize what you are resisting; the instant you can see from which quarter the winds of evidence are blowing against you. Be faithless to your cause and betray it to a stronger enemy. If you regard evidence as a constraint and seek to free yourself, you sell yourself into the chains of your whims. For you cannot make a true map of a city by sitting in your bedroom with your eyes shut and drawing lines upon paper according to impulse. You must walk through the city and draw lines on paper that correspond to what you see. If, seeing the city unclearly, you think that you can shift a line just a little to the right, just a little to the left, according to your caprice, this is just the same mistake.
...
Do not believe you do others a favor if you accept their arguments; the favor is to you. Do not think that fairness to all sides means balancing yourself evenly between positions; truth is not handed out in equal portions before the start of a debate. You cannot move forward on factual questions by fighting with fists or insults. Seek a test that lets reality judge between you.
Thanks @dcarli

A test

Morano links to this gem. It makes yet another claim that the state of climatology is "scandalous", which of course is inconsistent with all the others. Then it concludes by quoting one William Gilbert in a one page derivation that purports to explain everything important about climate without reference to the greenhouse effect.

Look at Gilbert's explanation. Then pick one of the following.

a) I don't understand what he is saying. I think it has calculus in it.

b) It makes perfect sense. It handily disproves all that IPCC hooey. I think it should be spread far and wide.

c) Neither a nor b.

I have some advice for you.

If (a) your problem is not one of logic but one of trust. You cannot figure this out for yourself and you need to figure out based on social reasoning who is telling you the truth and who is lying. This applies to many other technical matters besides climate change. You should read the book "What's the Worst That Could Happen?" by Greg Craven which is a very sane piece of advice for people in this position. After all, most people in democratic societies are in this position, and it's crucial to make the right decision even though you don;t really understand the arguments.

If (b) you overestimate your competence. Your confidence in conclusions matching your political beliefs is dominating your reason. You should be in group (a) but you overestimate your own abilities so you should try being irresponsible for a few years. You should take up less intellectually demanding hobbies and work on improving your personality.

If (c) stick around.

Debunking Gilbert's little undergraduate ploy is left as an exercise for the reader.

That people hold themselves in such esteem and the earth sciences in such contempt that they think things are so stupidly off-base is not remarkable. There are a lot of people in the world.

What is amazing is that someone whose full time job is to discuss these matters would see fit to promote it. It's another example of the extreme cynicism and contempt for reason that is so common nowadays. Morano probably has no idea that there is anything wrong with propagating this nonsense.

Wednesday, August 5, 2009

Talking to a Brick Wall Street

Jeffrey Sachs in Scientific American:
Let me make the invitation once again. Many of the world's leading climate scientists are prepared to meet with the editorial board of the Wall Street Journal, and to include in that meeting any climate-skeptic scientists that that the Journal editorial board would like to invite. The board owes it to the rest of us to make the effort to their own "open-minded search for scientific knowledge."

Tuesday, August 4, 2009

More Drought More Floods

Another striking example last night of rainfall unusually rare and unusually intense.

Klotzbach et al

An Alternative Explanation for Differential Temperature Trends at the Surface and in the Lower Troposphere

The abstract reads:
This paper investigates surface and satellite temperature trends over the period from 1979-2008. Surface temperature datasets from the National Climate Data Center and the Hadley Center show larger trends over the 30-year period than the lower-tropospheric data from the University of Alabama-Huntsville and Remote Sensing Systems datasets. The differences between trends observed in the surface and lower tropospheric satellite datasets are statistically significant in most comparisons, with much greater differences over land areas than over ocean areas. These findings strongly suggest that there remain important inconsistencies between surface and satellite records.
OK, first of all this is not an abstract, this is a teaser. If the title says "An alternative explanation", the abstract should tell us what it is. Writing as I'm reading, let's see whether the explanation presents itself and is defensible.

We start with an assertion (referencing the CCSP report I discussed yesterday) that "trends in thermometer-estimated surface warming have been larger than trends in the lower troposphere estimated from satellites and radiosondes", a statement which seems to me stronger than is warranted by that report.

However, the possibility that the discrepancy is due to an overestimate in surface trends is not ruled out, and they seem (surprise!) to be gearing up to do so. The discrepancy is most notable in the tropics.
In our current paper, we consider the possible existence of a warm bias in the surface temperature trend analyses
As James pointed out, this isn't exactly a warm bias, it is a bias in the trend. I'd prefer a "warming" bias to a "warm" bias and will use that expression.

Argument 1 in favor of a warming bias is that, lacking one,
there should not be an increasing divergence with time between the tropospheric and surface temperature anomalies [Karl et al., 2006]. The difference between lower troposphere and surface anomalies should not be greater over land areas.
Well, the first part is half-sensible. One needs also to eliminate the possibilities that 1) the measurements are real 2) the measurements are sufficiently noisy as to be indeterminate or 3) there is a cooling bias in the sondes and satellite records.

Argument 2 is that in the absence of a warming bias
the divergence should not be larger for both maximum and minimum temperatures at high latitude land locations in the winter.
One wonders if any meteorologists were involved at all. It's hard to fathom the word "divergence" being used in this way, but presumably this refers to the increasing difference between surface and troposphere estimates. Even with that said, I am having trouble parsing the claim. Are they saying the divergence is larger in winter than in summer? Are they claiming that this largerness supports a warming bias at the surface?
Our findings suggest that the supposed reconciliation of differences between surface and satellite datasets [Karl et al., 2006] has not occurred.
Did Karl et al make such a claim? It seems a bit of a straw man. It seems like Karl et al bent over backwards to leave room for Christy's position. Anyway after a fairly random pitch for UAH over RSS data, they separate surface points into land and sea points, and assert
Table 1 also clearly shows that there has been enhanced warming over land areas when compared with ocean areas, especially in the surface temperature datasets. For example, the NCDC dataset indicates nearly three times as much warming over land areas as over ocean areas during the past thirty years. Over this same time period, the UAH lower troposphere temperature estimate indicates about half as much warming over land areas, which is contradictory to the expected global surface/lower troposphere amplification

...

Table 1 also clearly shows that there has been enhanced warming over land areas when compared with ocean areas, especially in the surface temperature datasets. For example, the NCDC dataset indicates nearly three times as much warming over land areas as over ocean areas during the past thirty years. Over this same time period, the UAH lower troposphere temperature estimate indicates about half as much warming over land areas, which is contradictory to the expected global surface/lower troposphere amplification. However... there is a documented spurious warm shift in RSS data around 1992 that is the source of virtually all of the difference between the two satellite datasets. Thus, the closer agreement of RSS with the surface temperature datasets is likely largely due to this spurious jump.

Erased from d'Aleo's version of figure 1 is "the trend difference that would be expected given the 1.2 amplification factor expected from the models." Looking at the figure, we see that they are claiming that a surface temperature increase of dT should imply a tropospheric increase of 1.2 dT. 1.2 appears to be the global mean factor backed out of global models from Santer et al '05. It seems necessary to determine whether that paper separated out land and sea points. It's not clear why a global average ratio should apply over the much more rapidly warming non-maritime regions. Wouldn't the global troposphere be much more affected by maritime conditions than would the land surface?
The warm bias in the temperature data would most likely be in evidence over land areas where larger vertical temperature stratification occurs near the ground along with a reduction of the atmospheric cooling rate. This effect will be largest in the higher latitudes, especially in minimum temperatures during the winter months, since any reduction in the cooling rate of the of the atmosphere will result in a particularly large temperature increase near the ground surface in this strongly stably stratified boundary layer.
OK, again we mean a warming bias not a warm bias. But what does the rest of that claim mean?

I'm taking a break at this point.

Can anyone tell us what that bit (lines 319-324) means? If they are looking for a bias in the instrumental record, why are they making a dynamical argument?

Monday, August 3, 2009

e Pur Si Scalda


OK, so it's come to this. There are people who doubt it is even warming at all, even on a thirty year time scale. Presumably all the migrating species zones and retreating glaciers and shortened snow cover seasons don't count for anything.

Dick Cheney doesn't doubt it is warming. Sarah Palin doesn't doubt it is warming. Lake Mendota, for its part, is clear about what's happening in Wisconsin. But Joe d'Aleo of icecap thinks otherwise, and in certain circles he is taken at face value on such things.

As we saw a few days ago he is attributing the following:


to Klotzbach et al. 1999.

Per my suggestion this has been very slightly amended as follows:
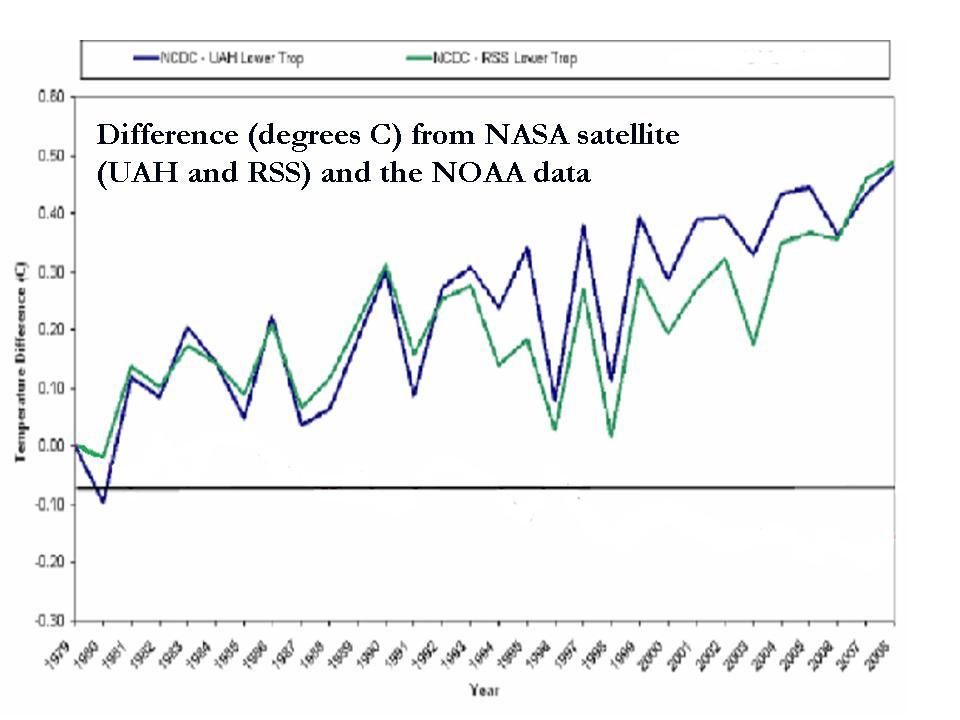
When you do a difference in the satellite trends of both UAH and RSS with NOAA NCDC land stations, you see an increasing warm bias in the NOAA data which explains why months with major cold in the news get ranked so high by NOAA and not by the satellite sources.
Emphasis added; d'Aleo has not acknowledged my advice or the importance of the change that I noticed.

Now this is a very consequential difference indeed, though the difference is hardly stressed in the narrative. Land data covers perhaps 25% of the earth. The difference of about 0.44 C (whatever it signifies) must be divided by 4, leaving an uncertainty in the trend of 0.11 C per 30 years, or about 0.04 C per decade. This is large enough to be a matter of some concern, but by no means large enough to change the big picture of global warming which are substantially higher. So I'm willing to write the whole thing off.

But considering the dramatis personae on this paper, one wonders exactly what is going on. Is d'Aleo's effort the leading edge of a push to make this a major talking point among certain disgruntled groups at the fringes of climate science? How does this outlier of a paper align with the CCSP report on lower atmosphere temeprature trends which clearly bent over backwards to give the Huntsville folk the benefit of the doubt?

I think that before taking up the Klotzbach paper, it's clear that we should be reading between the lines of the CCSP report.

One thing that report proves, anyway, is that dissenting opinions are hardly ignored in American science. Indeed, they get 130 page glossy reports trying to respond. Note that Christy is a coauthor of the executive summary, which states right off the bat that
Previously reported discrepancies between the amount of warming near the surface and higher in the atmosphere have been used to challenge the reliability of climate models and the reality of human induced global warming. ... This significant discrepancy no longer exists because errors in the satellite and radiosonde data have been identified and corrected. New data sets have also been developed that do not show such discrepancies.

...

For recent decades, all current atmospheric data sets now shouw global-average warming that is similar to the surface warming. While these data are consistent with the results form climate models at the global scale, discrepancies in the tropics remain to be resolved.
In short, the problems we are currently experiencing reconsiling model to data are much smaller than those in the past. This is a success in collaboration between observational and modeling communities first of all, and a demonstration of the power of models in the advancement of science.

Neither models nor observations are very clear about whether the surface is warming faster or slower than the troposphere. This is all about vertical amplification in the tropical troposphere.

The report acknowledges that the tropical middle-troposphere amplifies short time scales:
For month to month and year to year variations, models and observations both show amplification (the ... variations are larger aloft than at the surface.) This is a consequence of relatively simple physics, the effects of the release of latent heat as iar rises and condenses in clouds. The magnitude of this amplification is very similar in model and observations.
However, disagreement is found at longer time scales, where observations show greater warming at the surface while models retain greater warming aloft.

There is no obvious reason to prefer model prediction over observation data or the reverse. The data could be wrong or the model could be wrong. The CCSP report gears up to argue that it is the satellite data that is wrong.

Section 2 discusses the limitations of the observational data frankly. However, they note that discrepancies between satellite trends are much larger than discrepancies between surface trends.

All in all it's pretty much inside baseball. Everyone agrees we need the satellites to stay functioning. Got that, delayers? Nobody wins if we have no data, OK?

So all in all, I don't see where all the sound and fury is supposed to be leading. Despite huge progress, we still have an outstanding problem in contemporary atmospheric trends. OK. And?

Update: This show is in reruns. See the following articles on Realclimate:
So Klotzbach is a variation on a previous molehill.


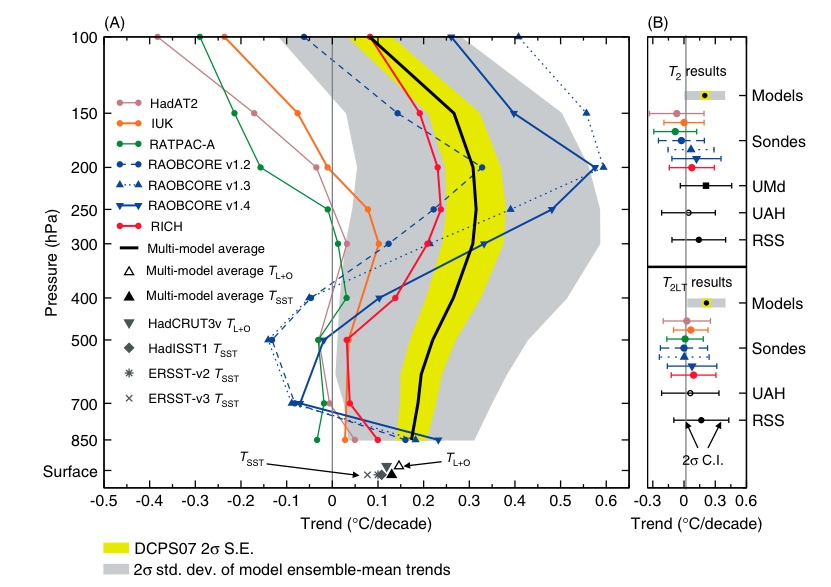
compares models and the datasets. Shaded is the range of model estimates of tropospheric temperature trend profile, while the lines represent various inversions of satellite data. The satellite inversion problem is not trivial. Extracting trends is more difficult yet, as some of the heuristics of the inversion may drift under climate change as well as under instrumental aging. The spread here makes clear that the method of doing so is not established. So when we look through Klotzbach, let's keep in mind that the spread in the estimates of the quantity of interest is huge.


And then there is this deep analysis from Ron House on Watts' site, which the beginning skeptic is invited to analyze. It involves feet and blankets. Really.

Sunday, August 2, 2009

The Ruins of the Unsustainable


"The ruins of the unsustainable are the 21st century's frontier."
- Bruce Stirling

There's a fascinating bit of futurism at worldchanging.org .

Commenting on recent data from the U.S. Census Bureau, business pundit Paul Kedrosky writes, "the U.S. currently has enough surplus housing to put the entire population of the U.K., with room left over for Israel." Given the enormous amount of embedded energy that this existing development represents, our best bet is put these buildings to good use.

Saturday, August 1, 2009

Hottest Month Ever in Austin TX

Other than the fact that your humble author lived through it, the fact that the calendar month just concluded was the warmest ever recorded in Austin TX (and that is pretty warm) is perhaps not a matter of great concern for readers of this blog.


Certainly it only provides a small iota of evidence in support of global warming. After all, Austin is not the globe. Even Texas itself is small compared to the world, believe it or not,

However, it ought to be a matter of concern for readers of ClimateDepot who are constantly fed a stream of information about anomalous cold events some of them from previous years. Surely, an unusual heat record ought to be of equal interest in establishing a balanced view of climate, right?

Right?

Update: Same deal, hottest month on record, for both Houston and College Station:
THE AVERAGE JULY TEMPERATURE AT COLLEGE STATION AND HOUSTON HOBBY
AIRPORT ARE NOW THE WARMEST AVERAGE MONTHLY TEMPERATURES EVER
RECORDED FOR ANY MONTH AT ANY TIME. IN OTHER WORDS...THERE HAS NOT
BEEN A MONTH WITH AN AVERAGE TEMPERATURE THAT WAS WARMER THAN WHAT
JUST OCCURRED AT EITHER COLLEGE STATION OR HOUSTON HOBBY.
(PUBLIC INFORMATION STATEMENT NATIONAL WEATHER SERVICE HOUSTON/GALVESTON TX 1018 AM CDT SAT AUG 1 2009)


Entitlement to Your Own Facts

It's time we faced up to the fact that there is an alternative reality, an alternative media with no respect for truth whatsoever. It started out as an effort to inject lies into the mainstream media, but now survives on its own and provides pseudo-information to a significant swath of the country.

We have been seeing this with our occasional friendly sniper David Duff, and the more typical and somewhat less respectful sniping that comes from "Glenn". David seems quite adamant that the satellite record is "better" than the surface record. I failed to engage with this question because this site is (as is the world) mostly interested in global long-term climate change, wherein I had thought the records in substantial agreement. So this emphasis on which temperature record to use struck me as a very minor point.

That depends, it turns out, on who you are listening to, whose facts you care to attend to.

On Twitter, Dan Satterfield points to this interesting recent report from the CCSP (sorry Dan, misplaced the tweet) entitled Temperature Trends in the Lower Atmosphere: Steps for Understanding and Reconciling Differences which I would take to be, if not definitive, at least worthy of reference in a discussion like this. Here is what they come up with:

The HadCRUT is a combination of land air temperature anomalies (Jones, 1994, CRUTEM1) and sea surface temperature anomalies (Parker et al., 1995) on a 5° x 5° grid-box basis. It' issued by the UK's Hadley Climate Research Unit ("HadCRU"). (I haven't spent much time with the observations community but I'd guess it's pronounced Had-Crew-Tee. Anyone?)

As you can see the agreement with satellite inversions, while not perfect, is not anything to lose sleep about as far as the big picture goes. Indeed, the big open question as far as the CCSP report goes is not whether the surface is or isn't warming, nor whether the lower troposphere is or isn't warming (in both cases, yes it is) but whether the lower troposphere is warming faster or slower than the surface. Here is what they say the state of the science is, from pages 1 and 2 of the executive summary:
  • For observations since the late 1950s, the start of the study period for this Report, the most recent versions of all available data sets show that both the surface and troposphere have warmed, while the stratosphere has cooled. These changes are in accord with our understanding of the effects of radiative
    forcing agents and with the results from model simulations.
  • Since the late 1950s, all radiosonde data sets show that the low and mid troposphere have warmed at a rate slightly faster than the rate of warming at the surface. These changes are in accord with our understanding of the effects of radiative forcing agents on the climate system and with the results from model simulations.
  • For observations during the satellite era (1979 onwards), the most recent versions of all available data sets show that both the low and mid troposphere have warmed. The majority of these data sets show warming at the surface that is greater than in the troposphere. Some of these data sets, however, show the opposite - tropospheric warming that is greater than that at the surface. Thus, due to the considerable disagreements between tropospheric
    data sets, it is not clear whether the troposphere has warmed more than or less than the surface.
  • The most recent climate model simulations give a range of results for changes in global-average temperature. Some models show more warming in the troposphere than at the surface, while a slightly smaller number of simulations show the opposite behavior. There is no fundamental inconsistency among these model results and observations at the global scale.
  • Studies to detect climate change and attribute its causes using patterns of observed temperature change in space and time show clear evidence of human influences on the climate system (due to changes in greenhouse gases, aerosols, and stratospheric ozone).
  • The observed patterns of change over the past 50 years cannot be explained by natural processes alone, nor by the effects of short-lived atmospheric constituents (such as aerosols and tropospheric ozone) alone.
OK, so, everything consistent with the other branches of climate science, right? The biggest open question is why there is extra lower tropospheric warming in some observational data. It would be modestly dynamically important if these data sets prove correct because it would call into question some modeling details, but presently (as of '06) the balance of evidence is against them. (More recent news on this front would be appreciated.)

Of course, the skeptics squad is mostly fascinated with observed trends rather than projections, so there's plenty of semi-healthy discussion of this stuff in the blogs. (A bit obsessed with short term variability, a bit confused about the sources thereof, but at least worried about real data.) But it's not the healthy stuff that concerns me here.

It's inconceivable that this sort of thing could really be at the root of all the hostility directed at the scientific community. Consider, though, this comment from "Glenn":
Michael,
Since its temperature graphs you want to talk about, note that your GISS graphs have come under heavy attack for their use of data affected by station dropout and poor siting. More valid graphs of atmospheric temperature trends come from the UAH satellite data - and they show essentially no change over the 30 years of data collection.
Glenn refers us to Joe d'Aleo's blog, wherein we find the following:


Note the caption: Difference between NOAA and UAH and RSS. (Larger image link) This agrees with the preceding paragraph: "the difference started small but is now approaching 0.5 C". Now if it were true, that would be a big deal.

But what if it were the case that the signals had high frequency differences but showed the same pattern over the long term? Well, that would mean that the individual measurements weren't perfect but were fit to the purpose of extracting low frequencies and trends, wouldn't it? Of course, the graph wouldn't look anything like d'Aleo's, would it.

Now to be fair, the HadCRUT isn't the NOAA series. Is the NOAA series such an outlier? Well, you'd expect the CCSP to say so if it were, but here's some confirmation that it isn't from Atmoz.

So, er, WTF? I mean d'Aleo's graph. It seems to bear absolutely no resemblance to the other stuff I see from any source as reputable as even Watts or better.

No resolving of the reference Klotzbach 2009 in the d'Aleo blog. In other words, it is not actually a reference, but only a reference shaped object. The Klotzbach in question, presumably, is the one who has picked up Gray's mantle as a predictor of hurricanes based on what I cynically call the tea leaf method. (Heuristics will not work if climate changes rapidly, and, um, climate is about to change rapidly.) But presumably Klotzbach is not going to feed fake results to d'Aleo, and then d'Aleo feed fake results to the denial people, who will then get all confused about the extent of disagreement in the observational record, would they?

The most charitable interpretation is that Klotzbach plotted something else, d'Aleo misinterpreted it and slapped a label on it, and Glenn and his sort happily believed it.

Now this is very recent; maybe nobody has tried to point this out to d'Aleo. Alas, I suppose I will have to try. But who knows how much similar stuff there is out there actively misleading people into thinking that either the entire observational record is worthless, or that "the satellites are better" because by implication from d'Aleo's bogus graph one would conclude that there is no observed warming at all!

This really isn't my turf but this episode tests my reduced ability to be shocked at shoddy tactics.

Note: Unfortunately I have not spotted a graph directly comparing NOAA/NCDC global temperature to the satellite record.

The Atmoz link compares NOAA/NCDC to HadCRUT and the CCSP graph compares HadCRUT to satellites. But it seems to me that "practically equal" is a transitive relation and so the d'Aleo stuff must be wrong. A link to a direct comparison or to directly comparable raw data would be appreciated.

Update: Joe d'Aleo has kindly provided the preprint of Klotbach et al submitted to JGR-A. The original graph caption is

There is a problem in that d'Aleo does not point out that the proposed discrepancy is over land only.

The paper is "An Alternative Explanation for Differential Temperature Trends at the Surface and in the Lower Troposphere" by Klotzbach, Pielke Sr., Pielke Jr., Christy and McNider, submitted to JGR-A.

I don't know that I should be evaluating the paper itself prior to publication. As far as I know this remains a preprint.

I still find this confusing compared to other information I have seen, but not nearly as much so given that it refers to land temperatures only. d'Aleo should at minimum correct his caption to indicate that the graph refers to land points only.

Update: The preprint is published on the web (PDF), so it seems blogworthy. Any opinions here on how much sense it makes, or links to same elsewhere, appreciated.